I wanted to figure out how to create gif animation using the magick, so I decided I’ll try that out with ggplot2 spiral art.
Loading up packages
I’m definitely in love with “magick” right now :)
library(tidyverse) ## for pretty much everything...
library(magick) ## I'm now a magick fan!!!
library(scales) ## Handy when it comes to scaling, but I also love show_col function
library(patchwork) ## put ggplot side by side easily :)

## Let's just set some of my favourite number.
phi <- (1 + sqrt(5)) / 2
golden_angle <- pi*(3-sqrt(5))
Function To Draw Artwork
Instead of creating data frame, then plot with different parameters, I’ve created function so that I can tweak some of parameters to create different art.
- n : changes number of points to use (number of rows in data frame to plot)
- u : I’m making art by drawing lines by connecting dots, but skipping “u” numbers of dots in between.
- v : Useful to set if you want to create rotating animation
- angle: using golden angle will produce nice phyllotactic spiral, but we can use different angle to produce different art
create_art <- function(n=1800,u=5,v=0,angle=golden_angle,colors="#ffffff",...){

  my_colours <- colors ## default is using one colour, white, but I can use vector of colours too.

  ## Create data frame first using those parameters specified above
  df <- tibble(
    idx = c(0:(n-1)), ## you can increase the number here to use more lines.
    t = seq(0,2*pi,length.out=n),  ## since I used 0 to 1800 above, need to add 1
    r = sqrt(idx), ## radius
    x = r*cos(angle*idx),
    y = r*sin(angle*idx),
    color_angle = atan2(y=y,x=x) ## get angle between x-axos and the vector from the origin to x,y
  )

  ## In case you specified m2>m then change
  v <- ifelse(v<u,v,v%%u)
  max_r <- max(df$r)*1.1
  #print(max_r)

  my_art <- df %>%
    ggplot(aes(x=x,y=y,color=color_angle)) +
    geom_path(data= . %>% filter(idx%%u==v), ## only use partial data to connect the dots
              lineend="round", linejoin="mitre", linemitre=3,
              aes(size=idx, alpha=idx)) +
    coord_fixed() +
    theme_void() +
    scale_alpha_continuous(guide="none", range=c(0,1), trans="sqrt")+
    scale_size_continuous(guide="none",  range=c(10,0), trans="sqrt") +
    scale_color_gradientn(guide="none",
                          colors=my_colours) +
    theme(panel.background = element_rect(fill="#000000de")) +
    expand_limits(x=c(-max_r,max_r),y=c(-max_r,max_r))

  my_art + annotate(geom="text", x=Inf,y=-Inf,
                    label=str_glue('n: {n} | u: {u} | v: {v} | angle: {round(angle,3)} radian'),
                    family="Roboto Condensed", color="#ffffffae",
                    hjust=1,vjust=-1)
}


## Using all default value to plot!
create_art() +
  ## using below just to make canvas wider to fit blog post nicer?
geom_blank(data=data.frame(), aes(x=c(-phi*50,phi*50),y=c(-50,50), color=c(0,0))) 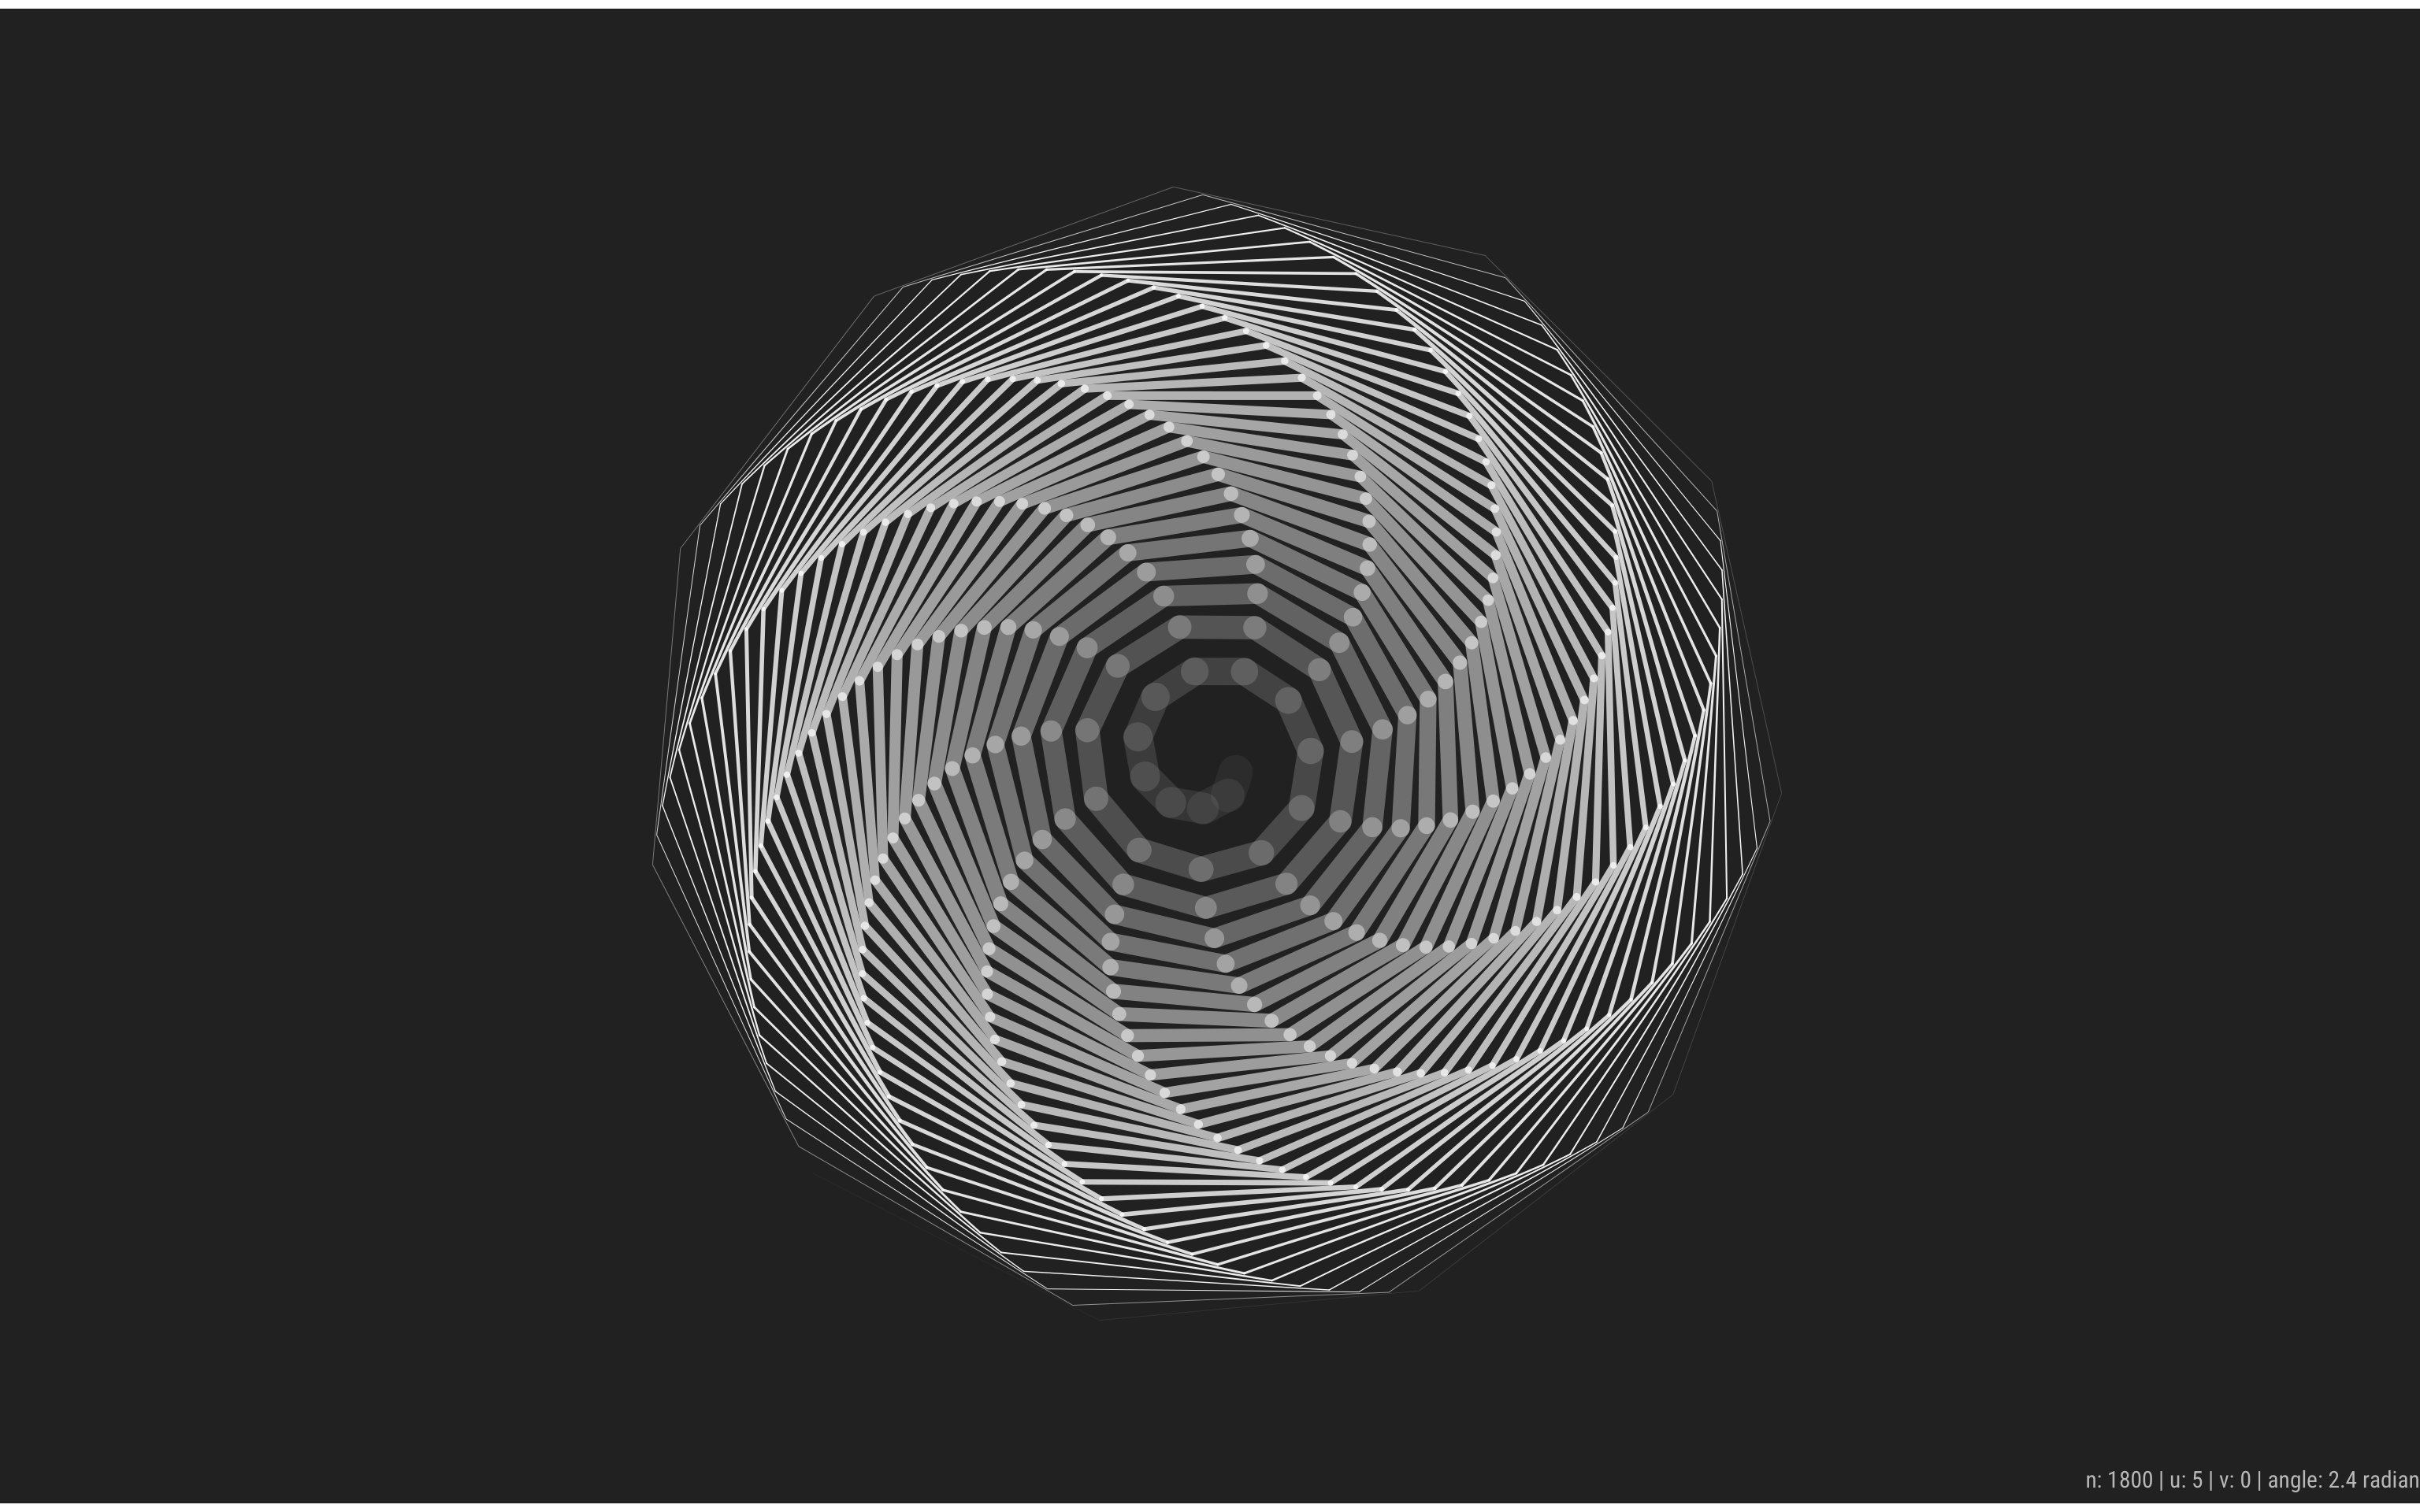
Variation of Art by Tweaking Some Parameters
Arranging plot side by side is very easy with package patchwork!
## changing up the angle
create_art(n=360,angle=sqrt(2)) +
  create_art(n=360,angle=sqrt(3)) +
  create_art(n=360,angle=sqrt(5)) +
  create_art(n=360,angle=pi/7) +
  create_art(n=360,angle=pi/9) +
  create_art(n=360,angle=pi/46) +
  create_art(n=360,angle=2) +
  create_art(n=360,angle=1) +
  plot_layout(ncol = 4)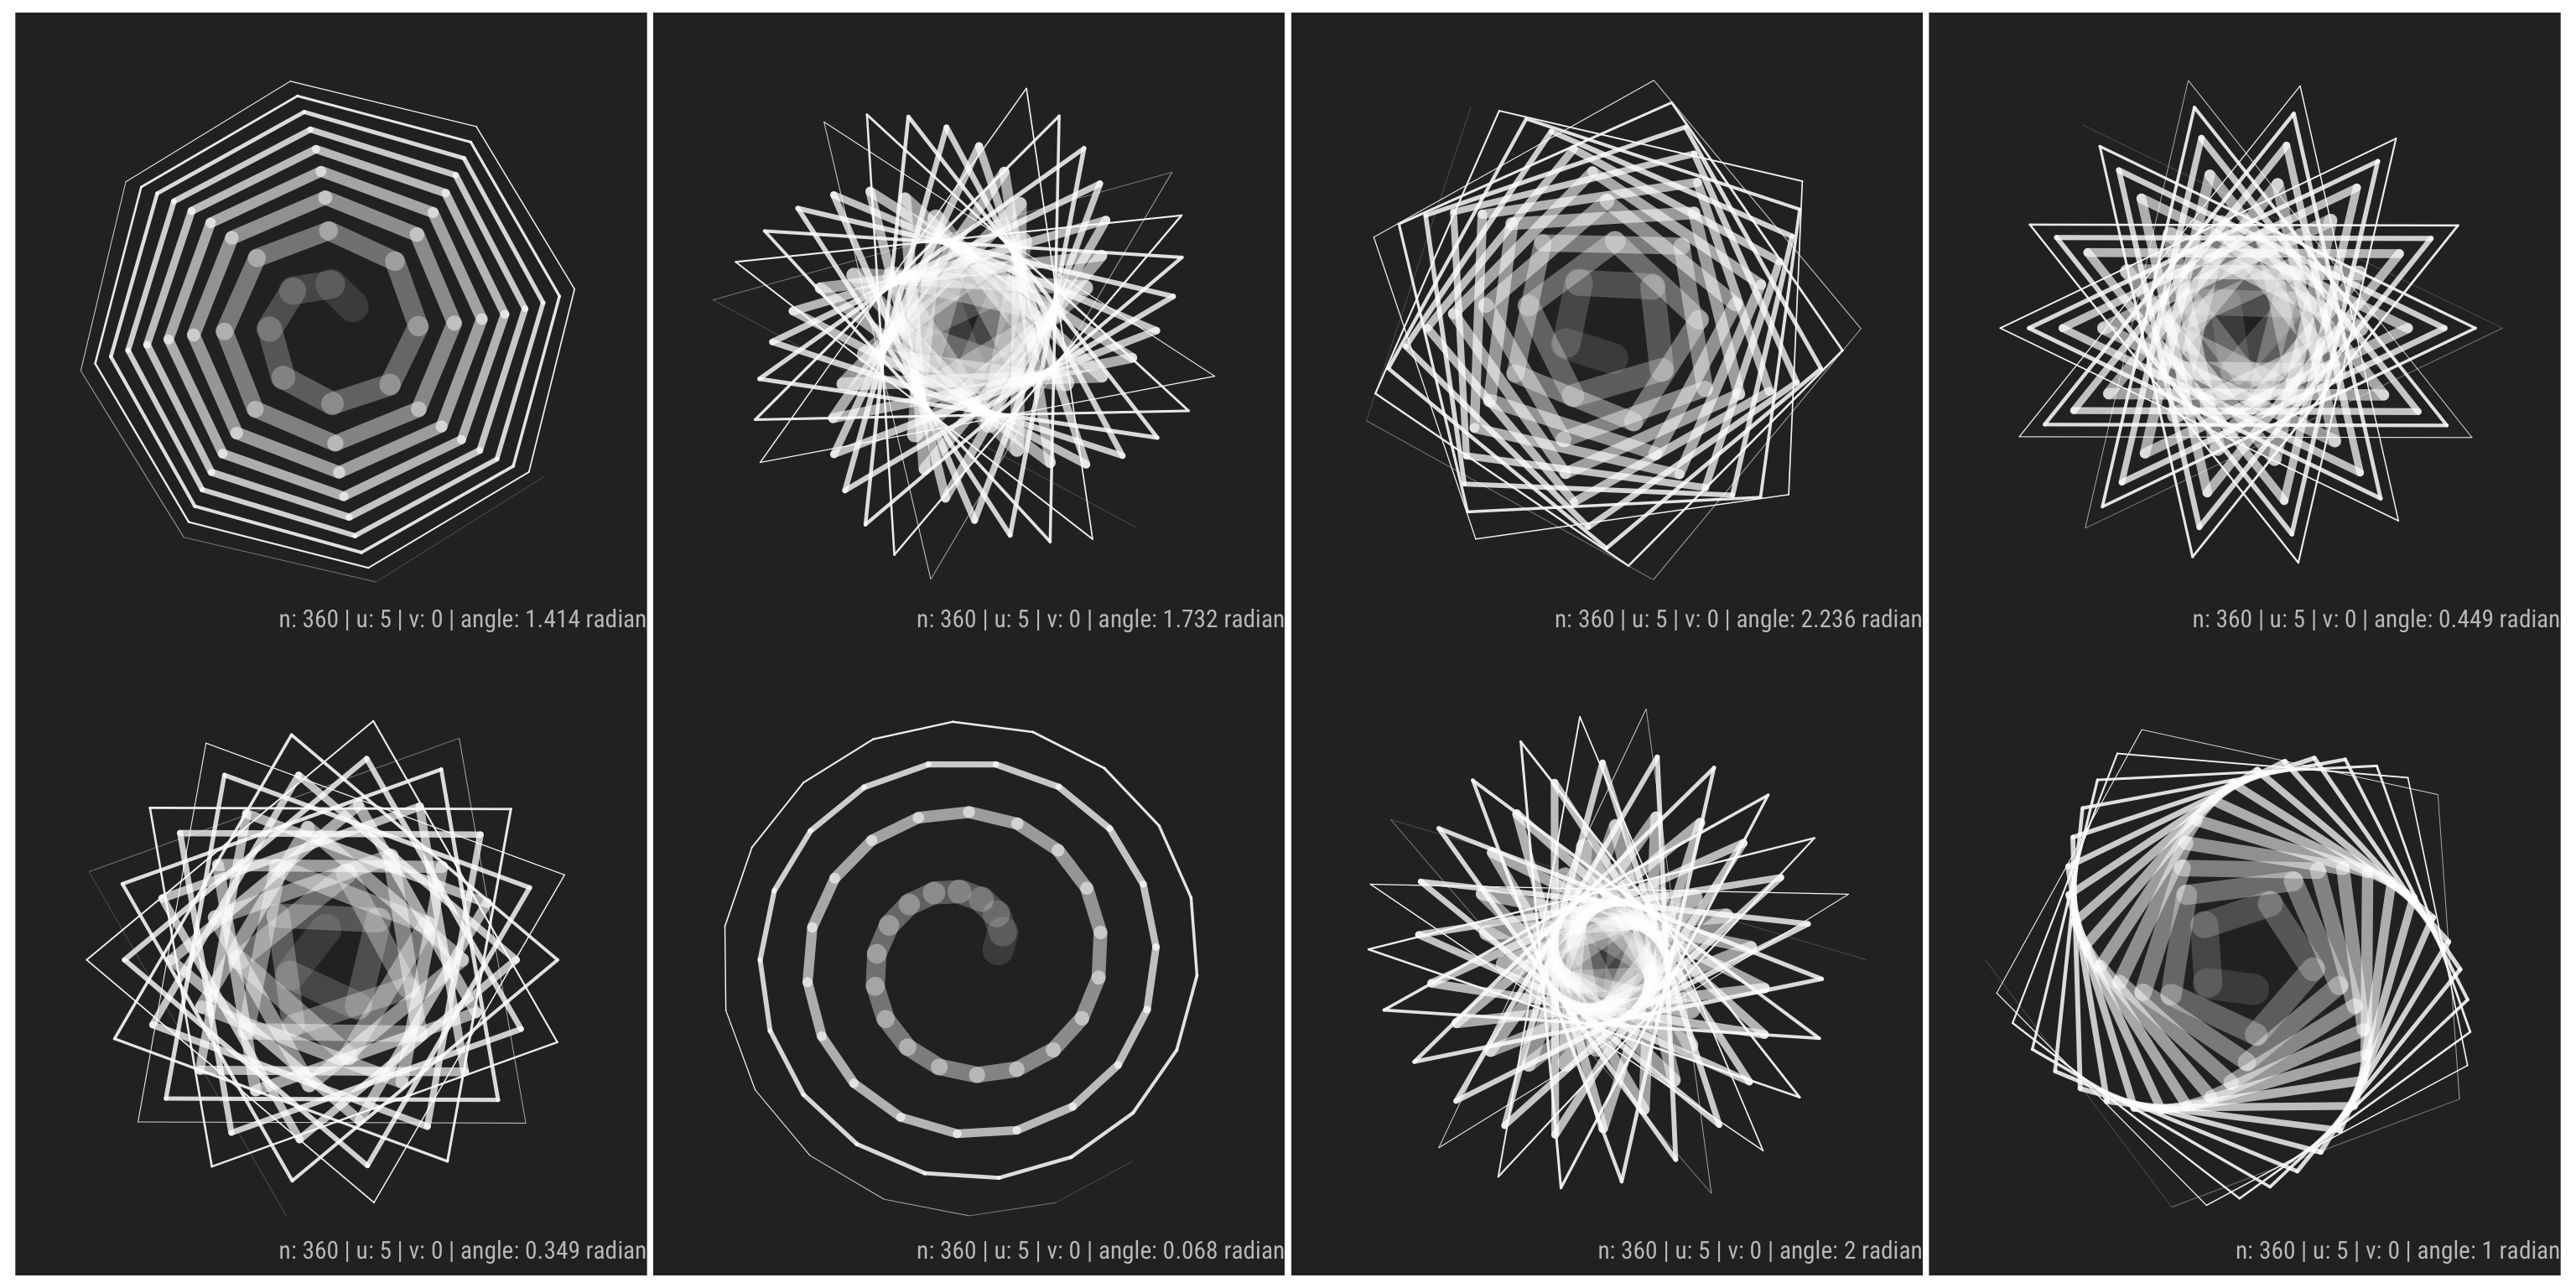
## changing up the u value - number of points to skip in order to connect the points
create_art(n=360,u=5) +
  create_art(n=360,u=11) +
  create_art(n=360,u=13) +
  create_art(n=360,u=6) +
  create_art(n=360,u=9) +
  create_art(n=360,u=8) +
  create_art(n=360,u=17) +
  create_art(n=360,u=3) +
  plot_layout(ncol = 4)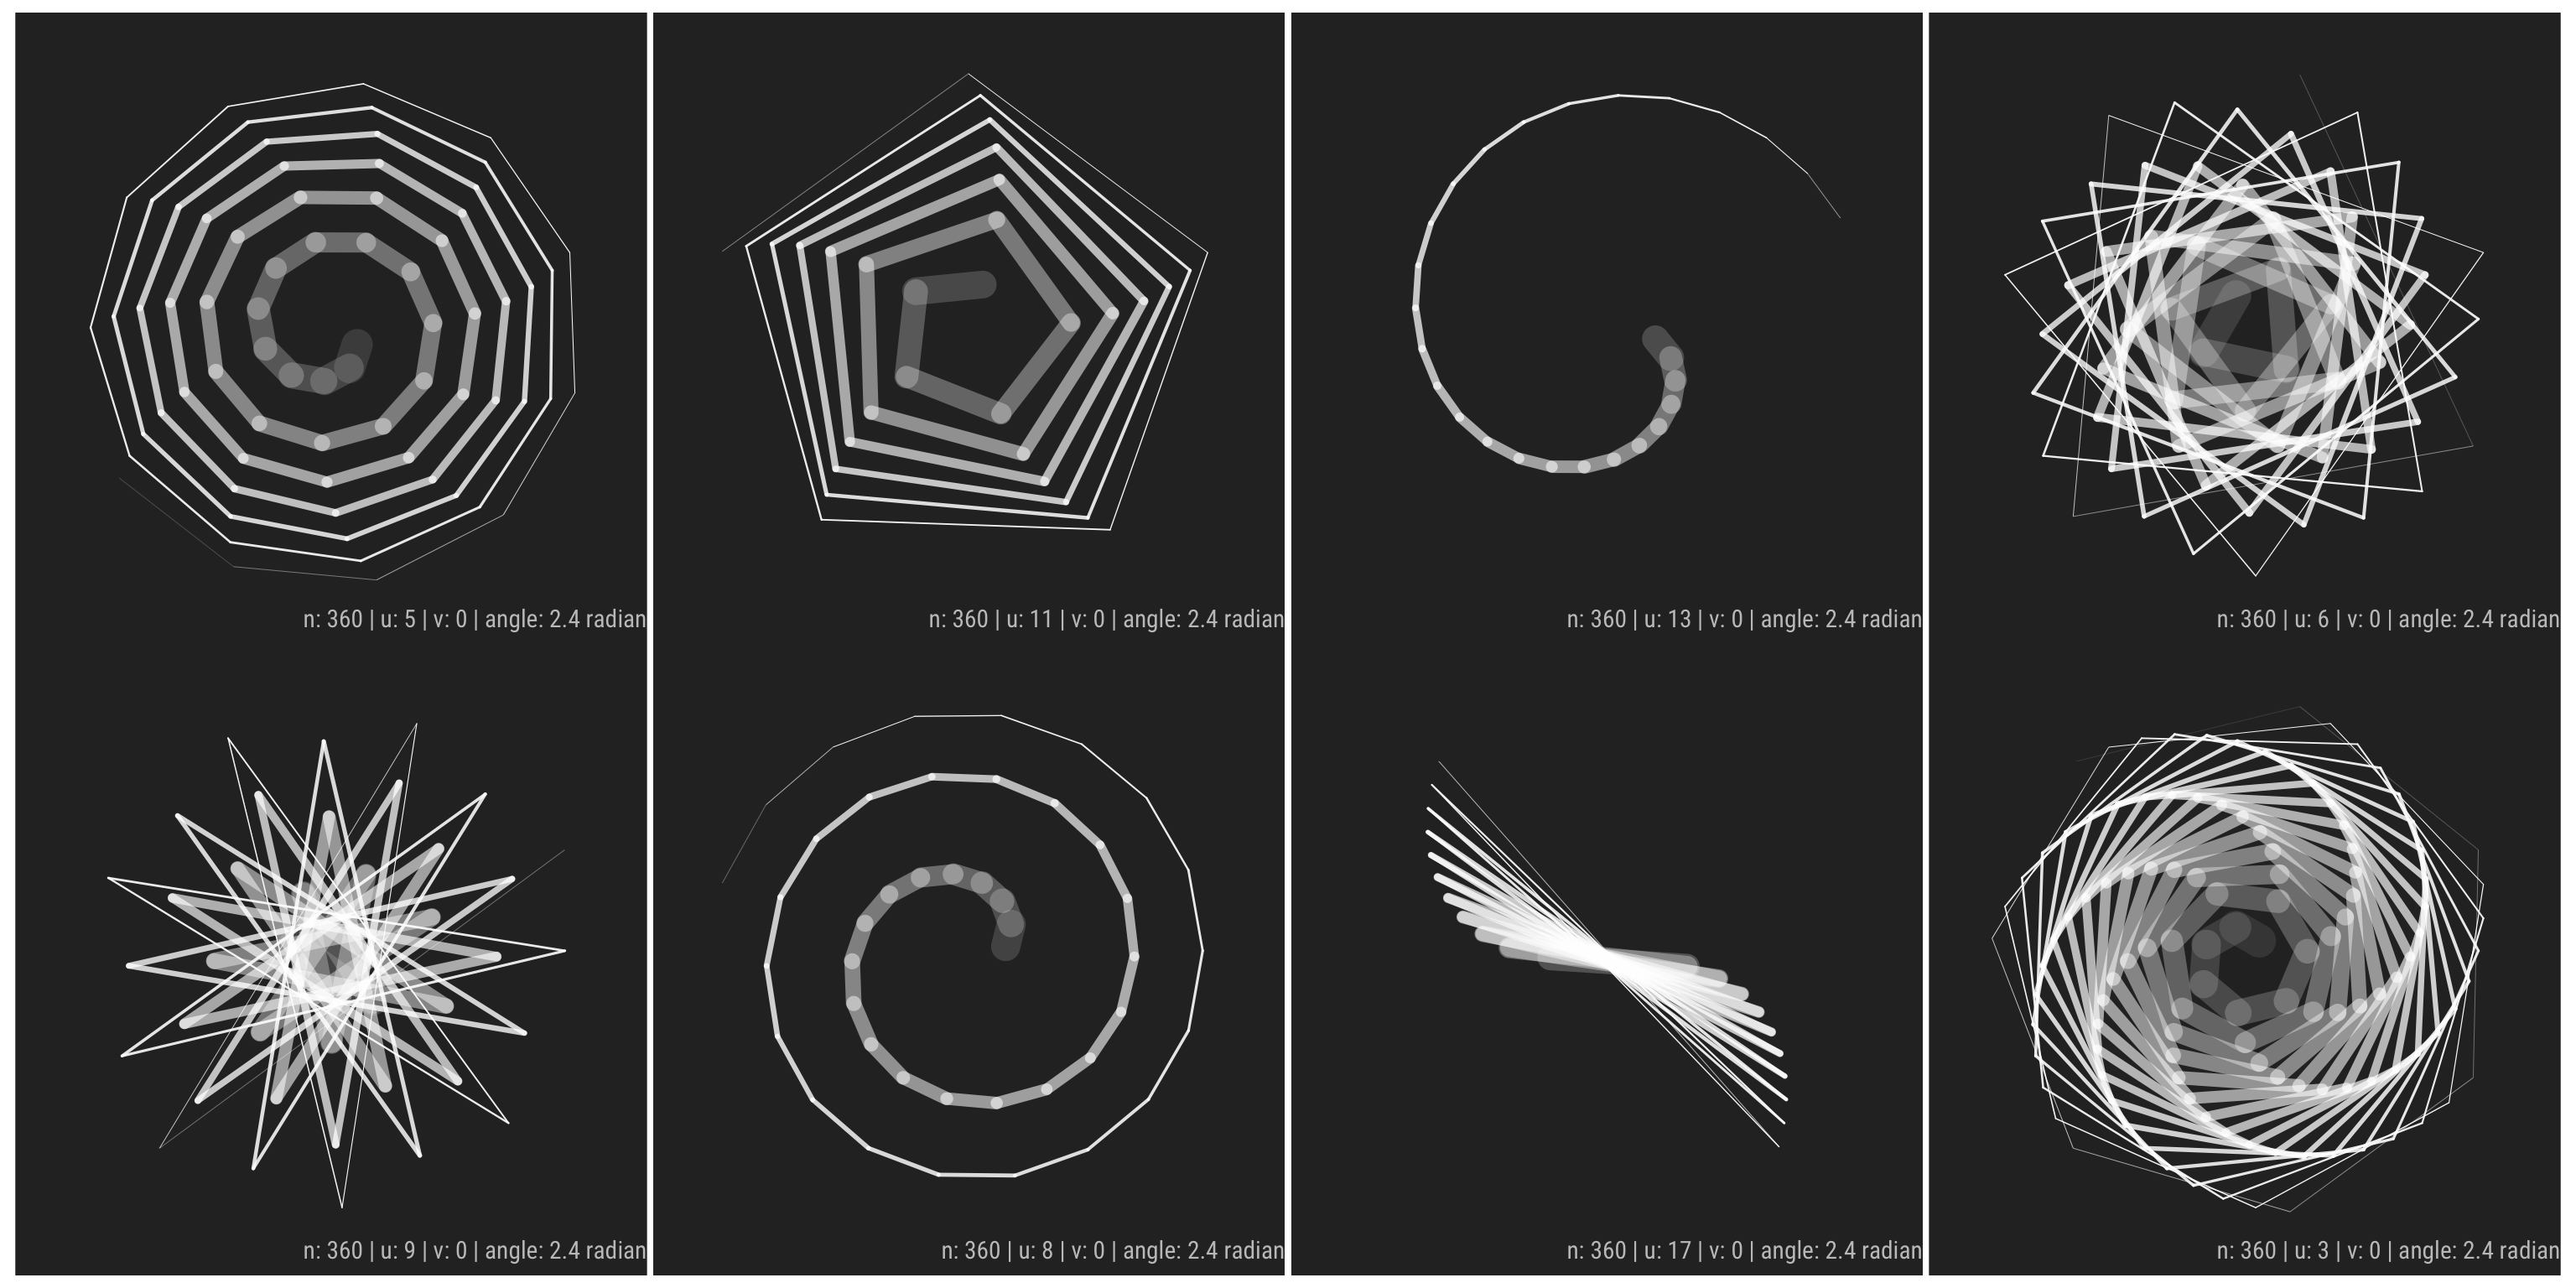
Creating Animation GIF!!!
I’ve just discovered that I can utizile image_graph function in magick! I couldn’t figure out if there’s way to plot 2 gifs next to each other, so that both are showing side by side. I also coulnd’t figure out how to plot multiple images using map function but not displaying [[1]] [[2]] [[3]] in output…
## Create Rotating Animation
#imgs_1 <- image_graph(width=600, height=600)
#params <- tibble(n=1800,u=44,v=seq(0,u-1,by=2),angle=golden_angle)
#params %>% pwalk(.,~create_art(.) %>% print())
#dev.off()

## Smoother animation
#imgs_2 <- image_graph(width=600, height=600)
#params <- tibble(n=1800,u=22,v=seq(0,u-1,by=1),angle=-golden_angle)
#params %>% pmap(.,create_art)
#dev.off()

image_animate(imgs_1,fps=10)
image_animate(imgs_2,fps=10)
Plotting Image Side by Side with image_append
While I wasn’t sure how to put 2 animation gifs next to each other, I was able to put images side by side using image_append function!
## I'm commenting out below, because I couldn't figure out how to run it silently...
#imgs_3 <- image_graph(width=400, height=400)
#params <- tibble(n=640,u=5,v=seq(0,u-1,by=1),angle=golden_angle)
#params %>% pmap(.,create_art)
#dev.off()
image_join(imgs_3) %>% image_append()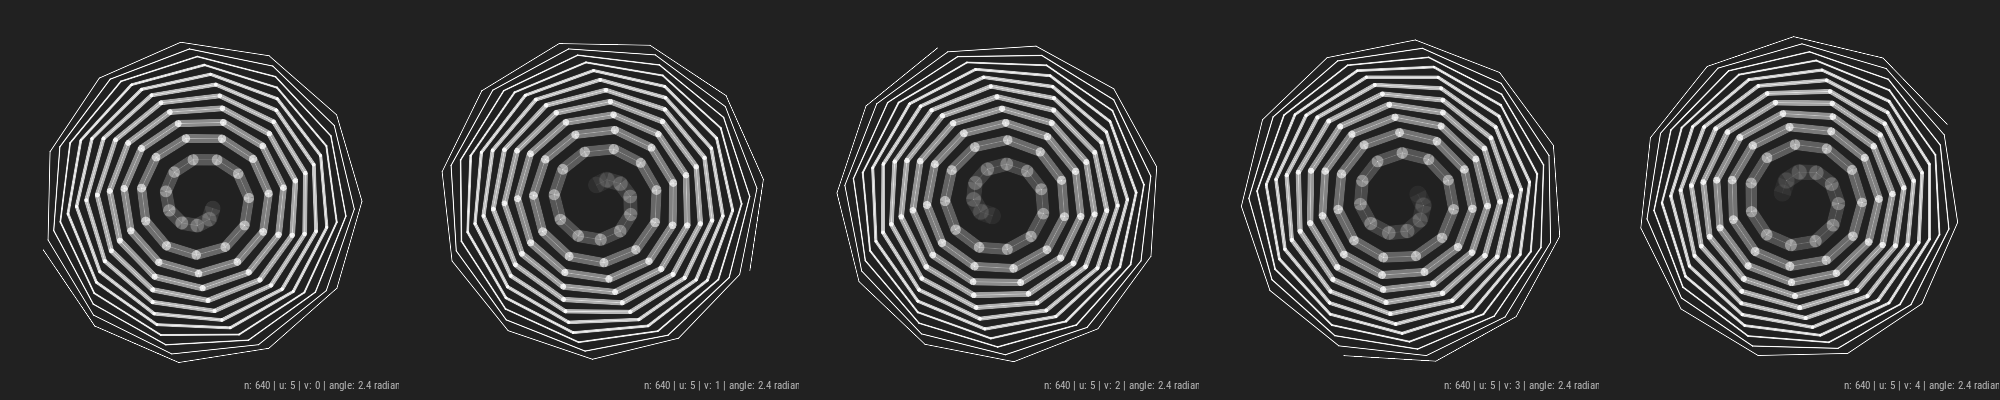
#imgs_4 <- image_graph(width=400, height=400)
#params <- tibble(n=640,u=10,v=seq(0,u-1,by=2),angle=c(sqrt(2),sqrt(3),sqrt(4),sqrt(5),sqrt(6)))
#params %>% pmap(.,create_art)
#dev.off()
image_join(imgs_4) %>% image_append()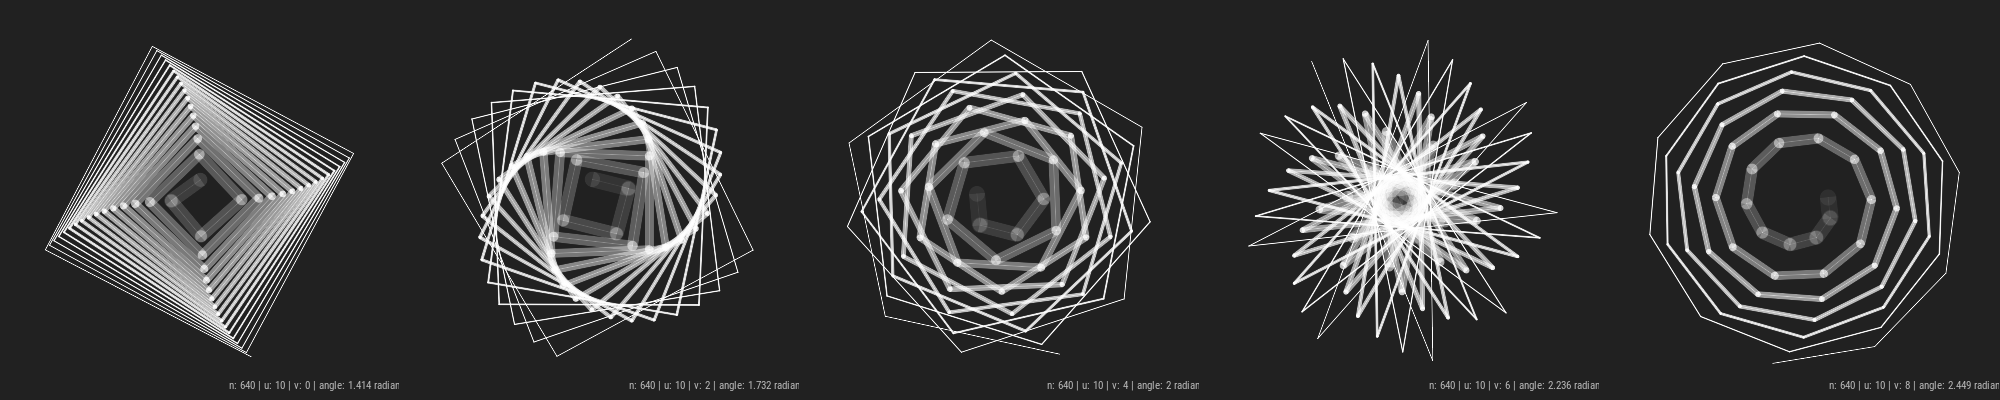
Generating Art with Different Colour Palette!
## Finally You can also add colours to it.
create_art(u=36,colors=hue_pal()(4)) +
  create_art(u=36,colors=hue_pal(c=60)(4))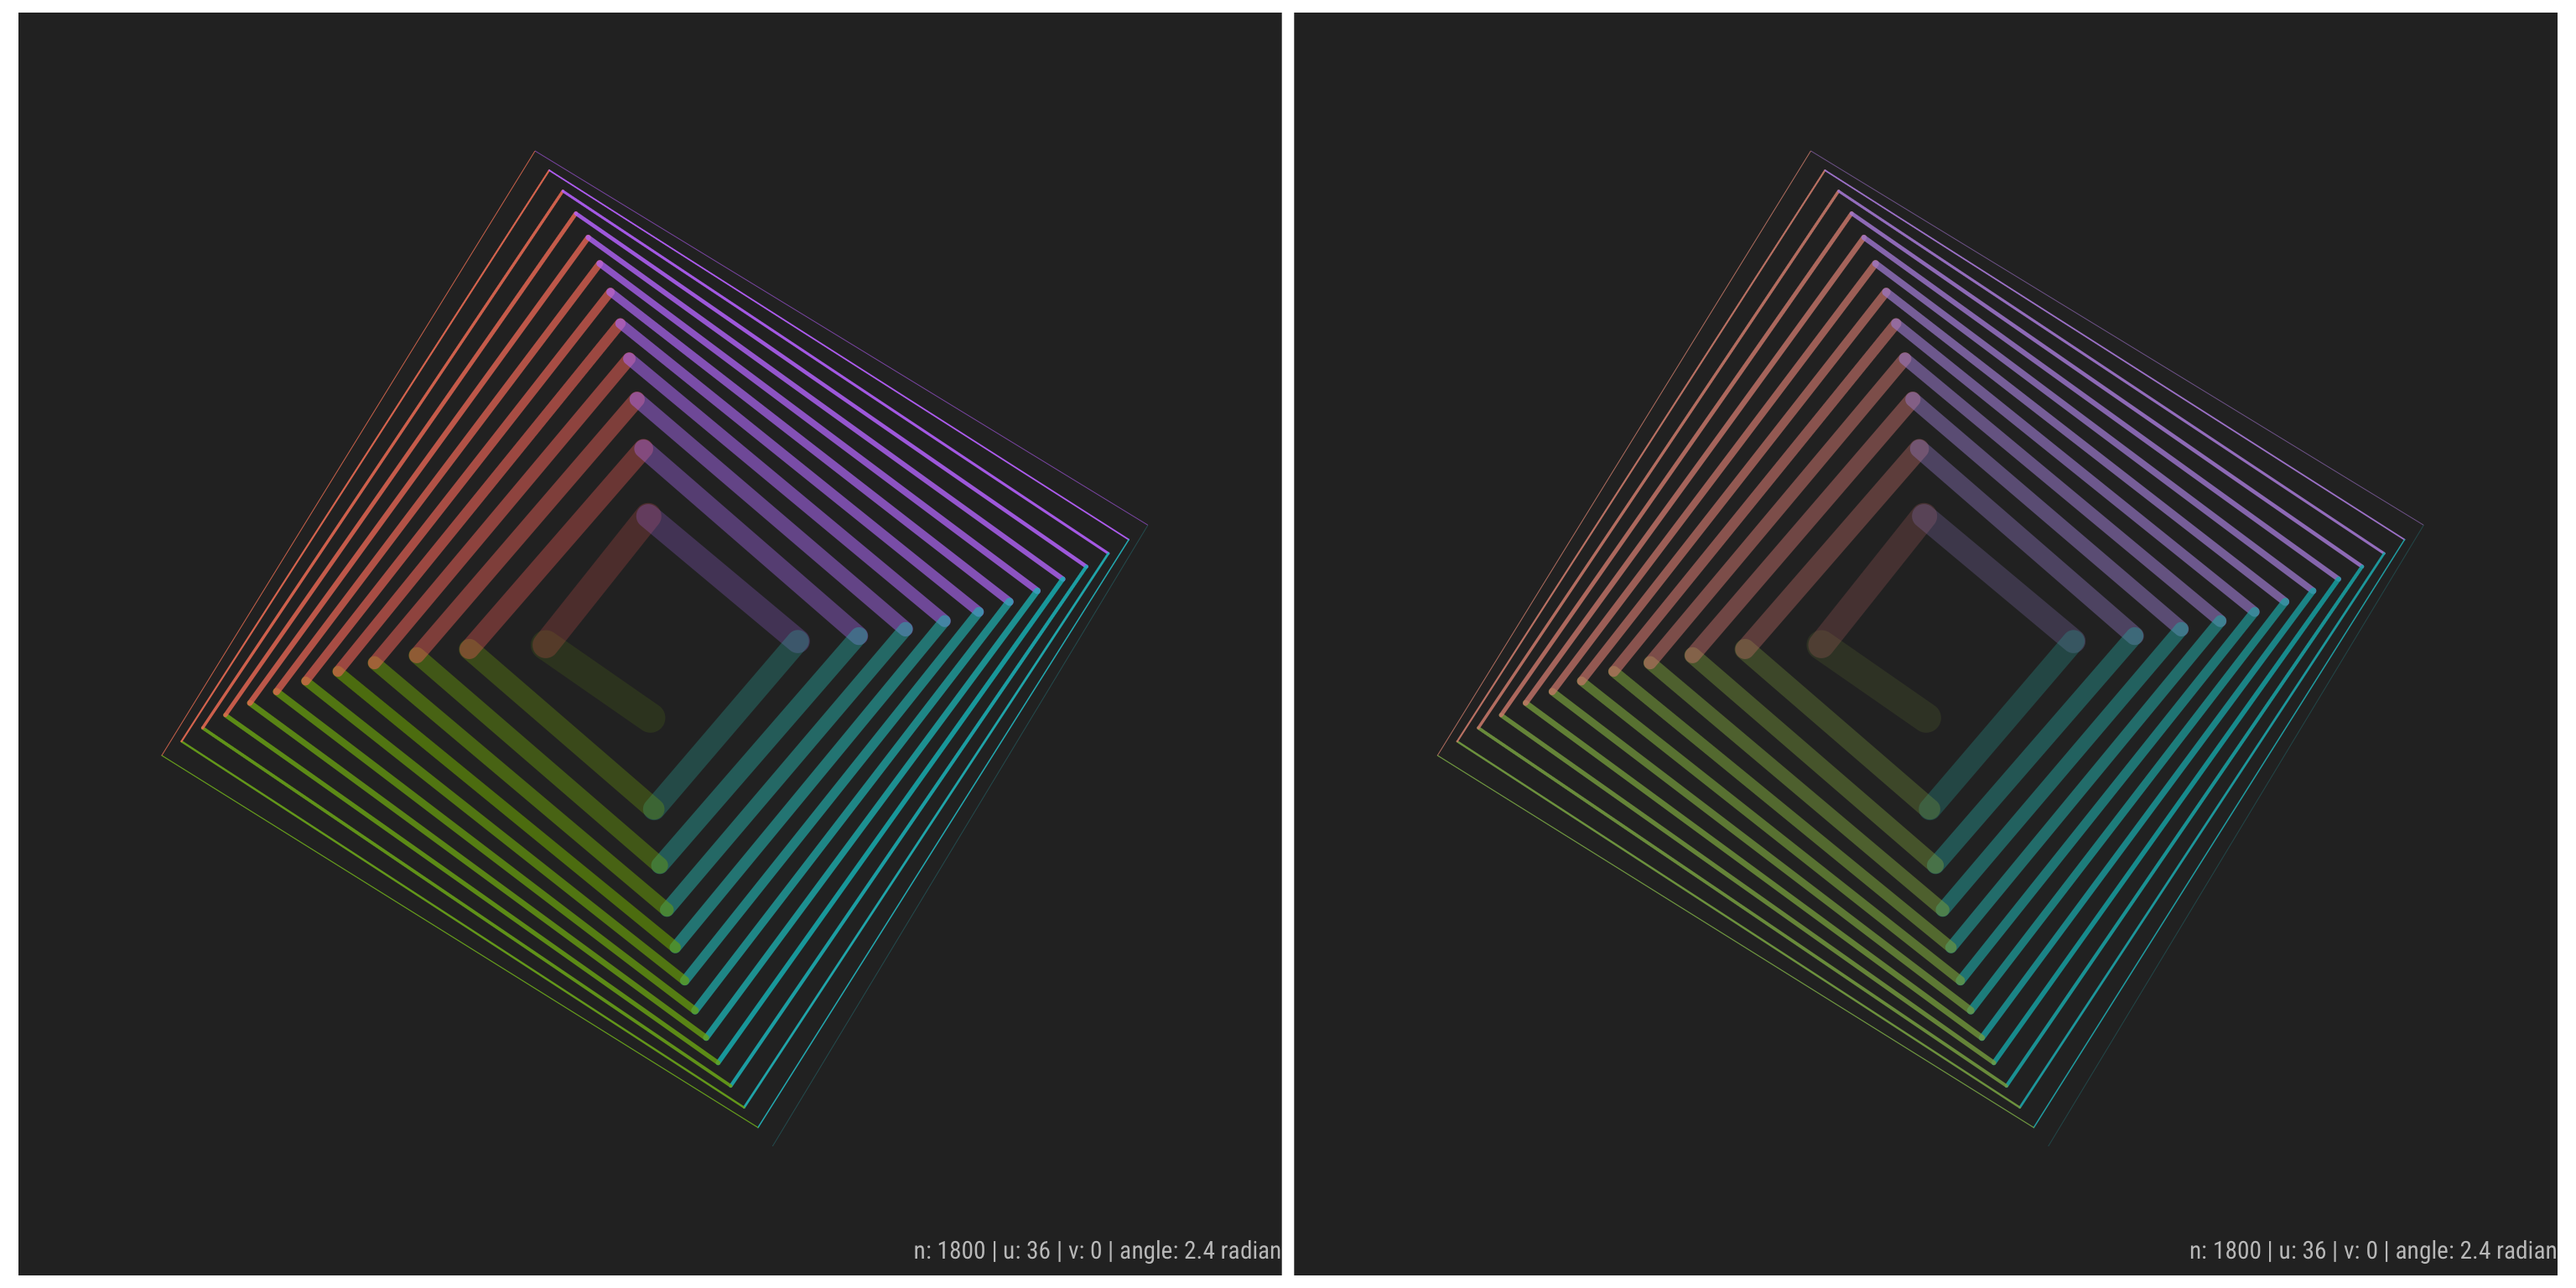
## Using different palette
create_art(u=8,colors=ggthemes::tableau_color_pal("Hue Circle")(19), angle=2*pi-golden_angle) +
create_art(u=8,colors=ggthemes::tableau_color_pal("Classic Cyclic")(13)) 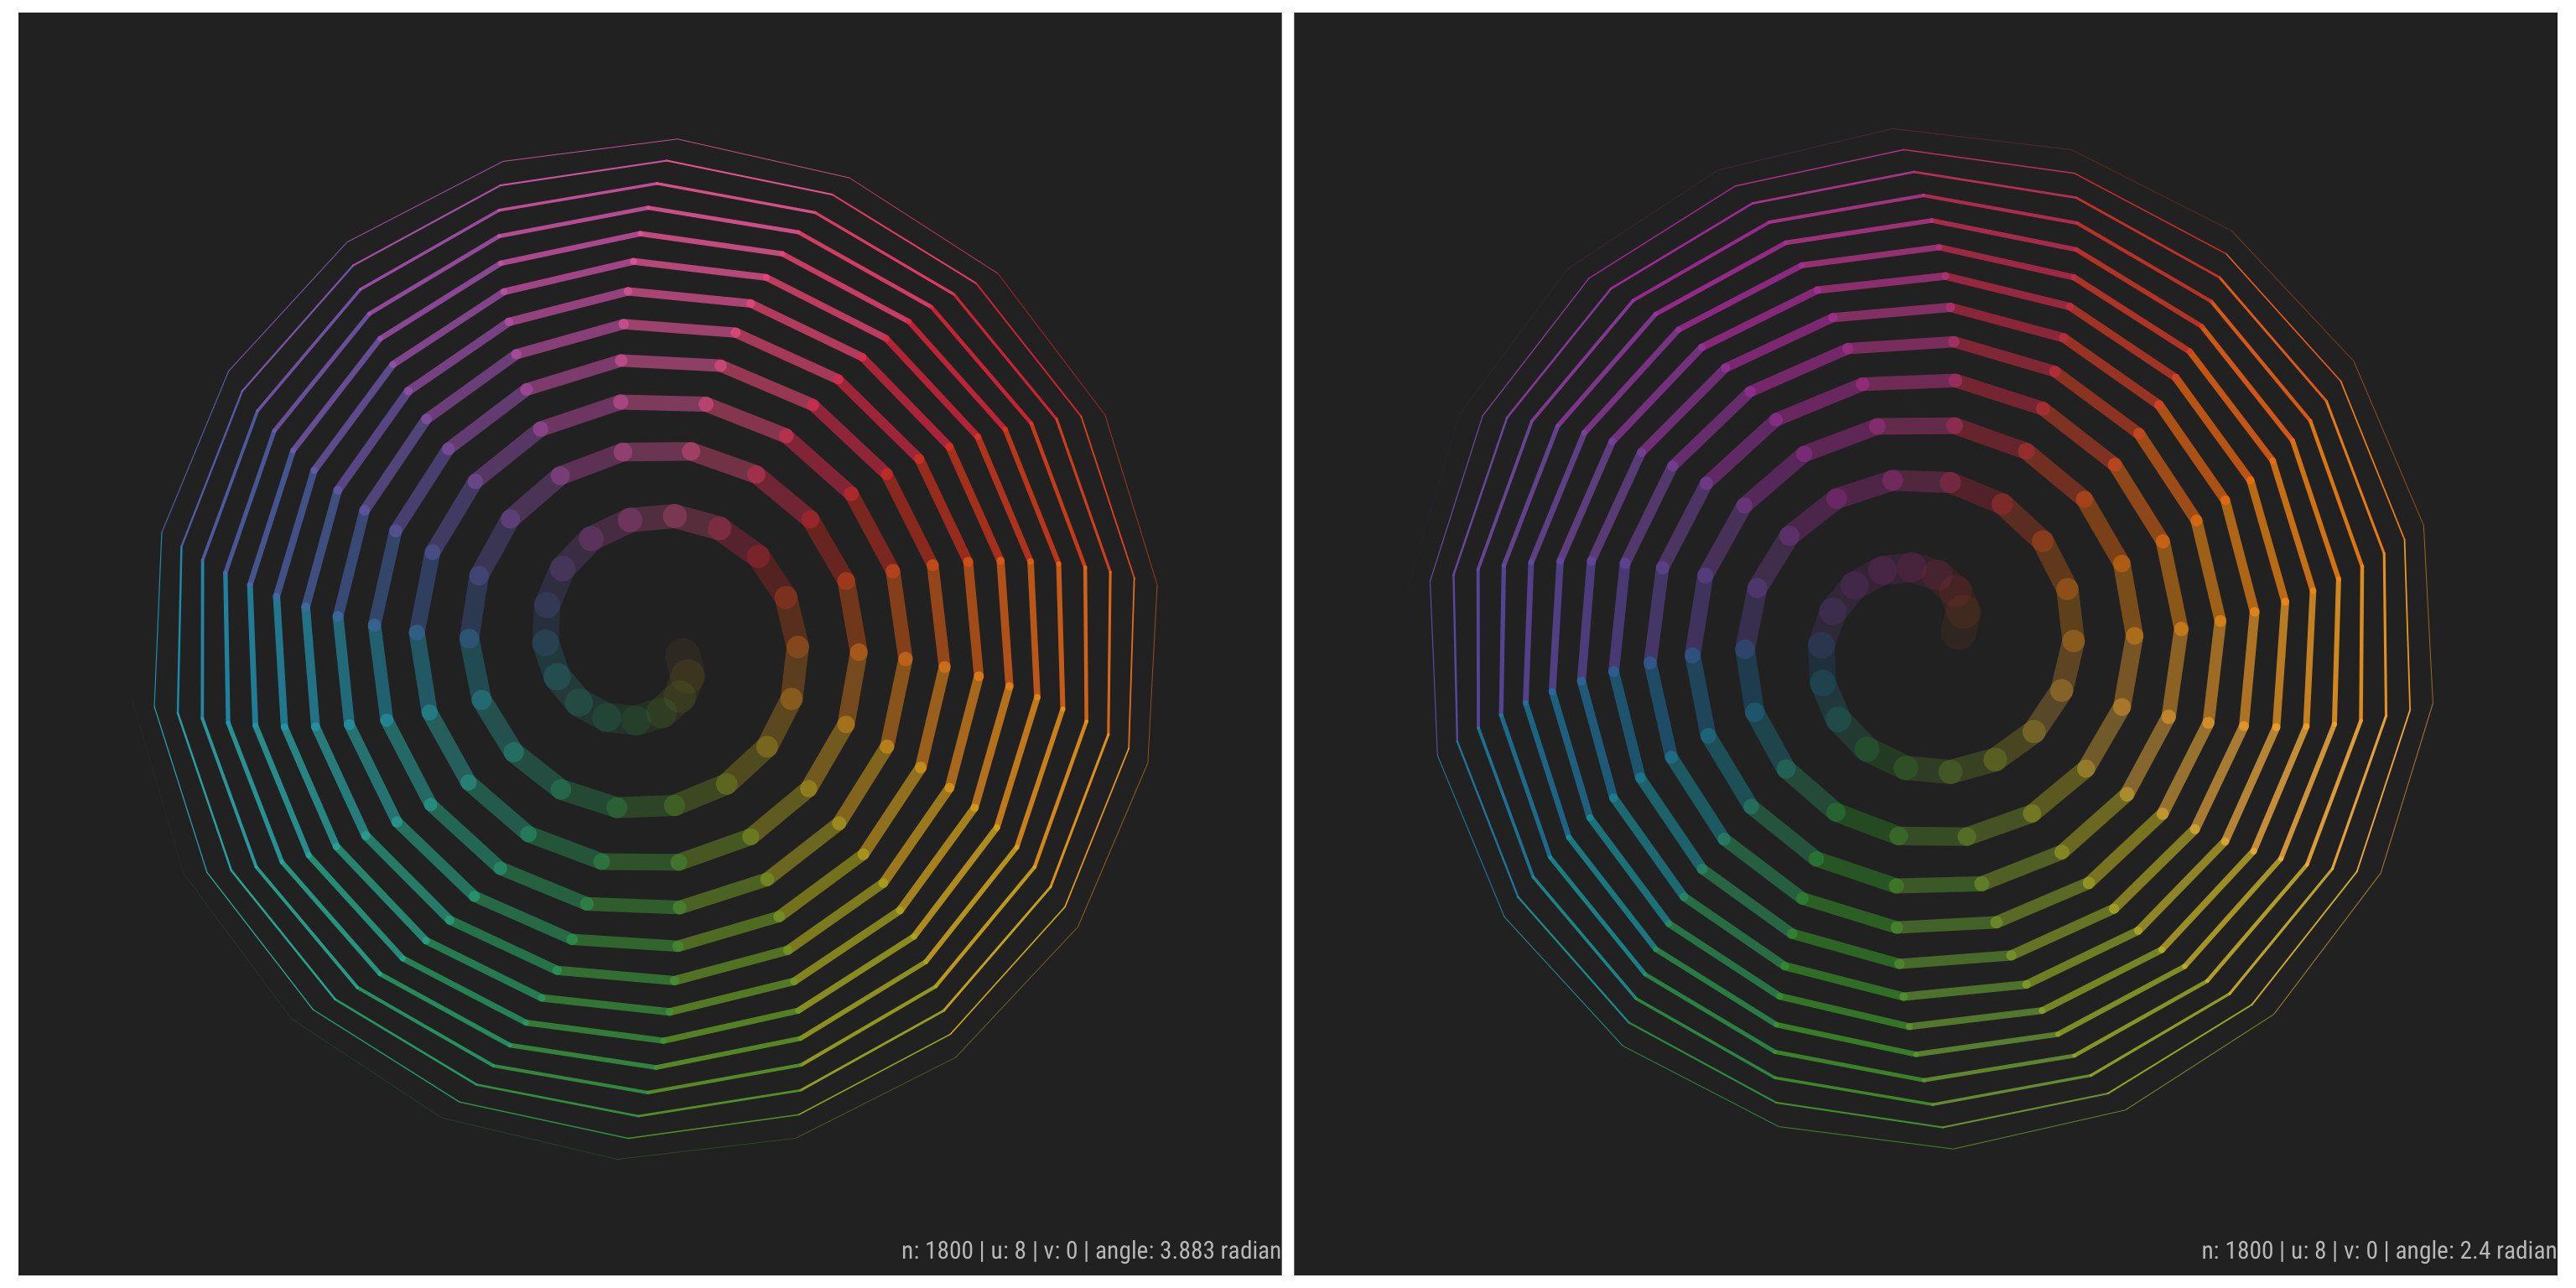
## One Last one!
create_art(n=3600,u=18, colors=ggthemes::canva_pal("Fun and cheerful")(4)) +
  create_art(n=3600,u=18, colors=ggthemes::canva_pal()(4), angle=-golden_angle)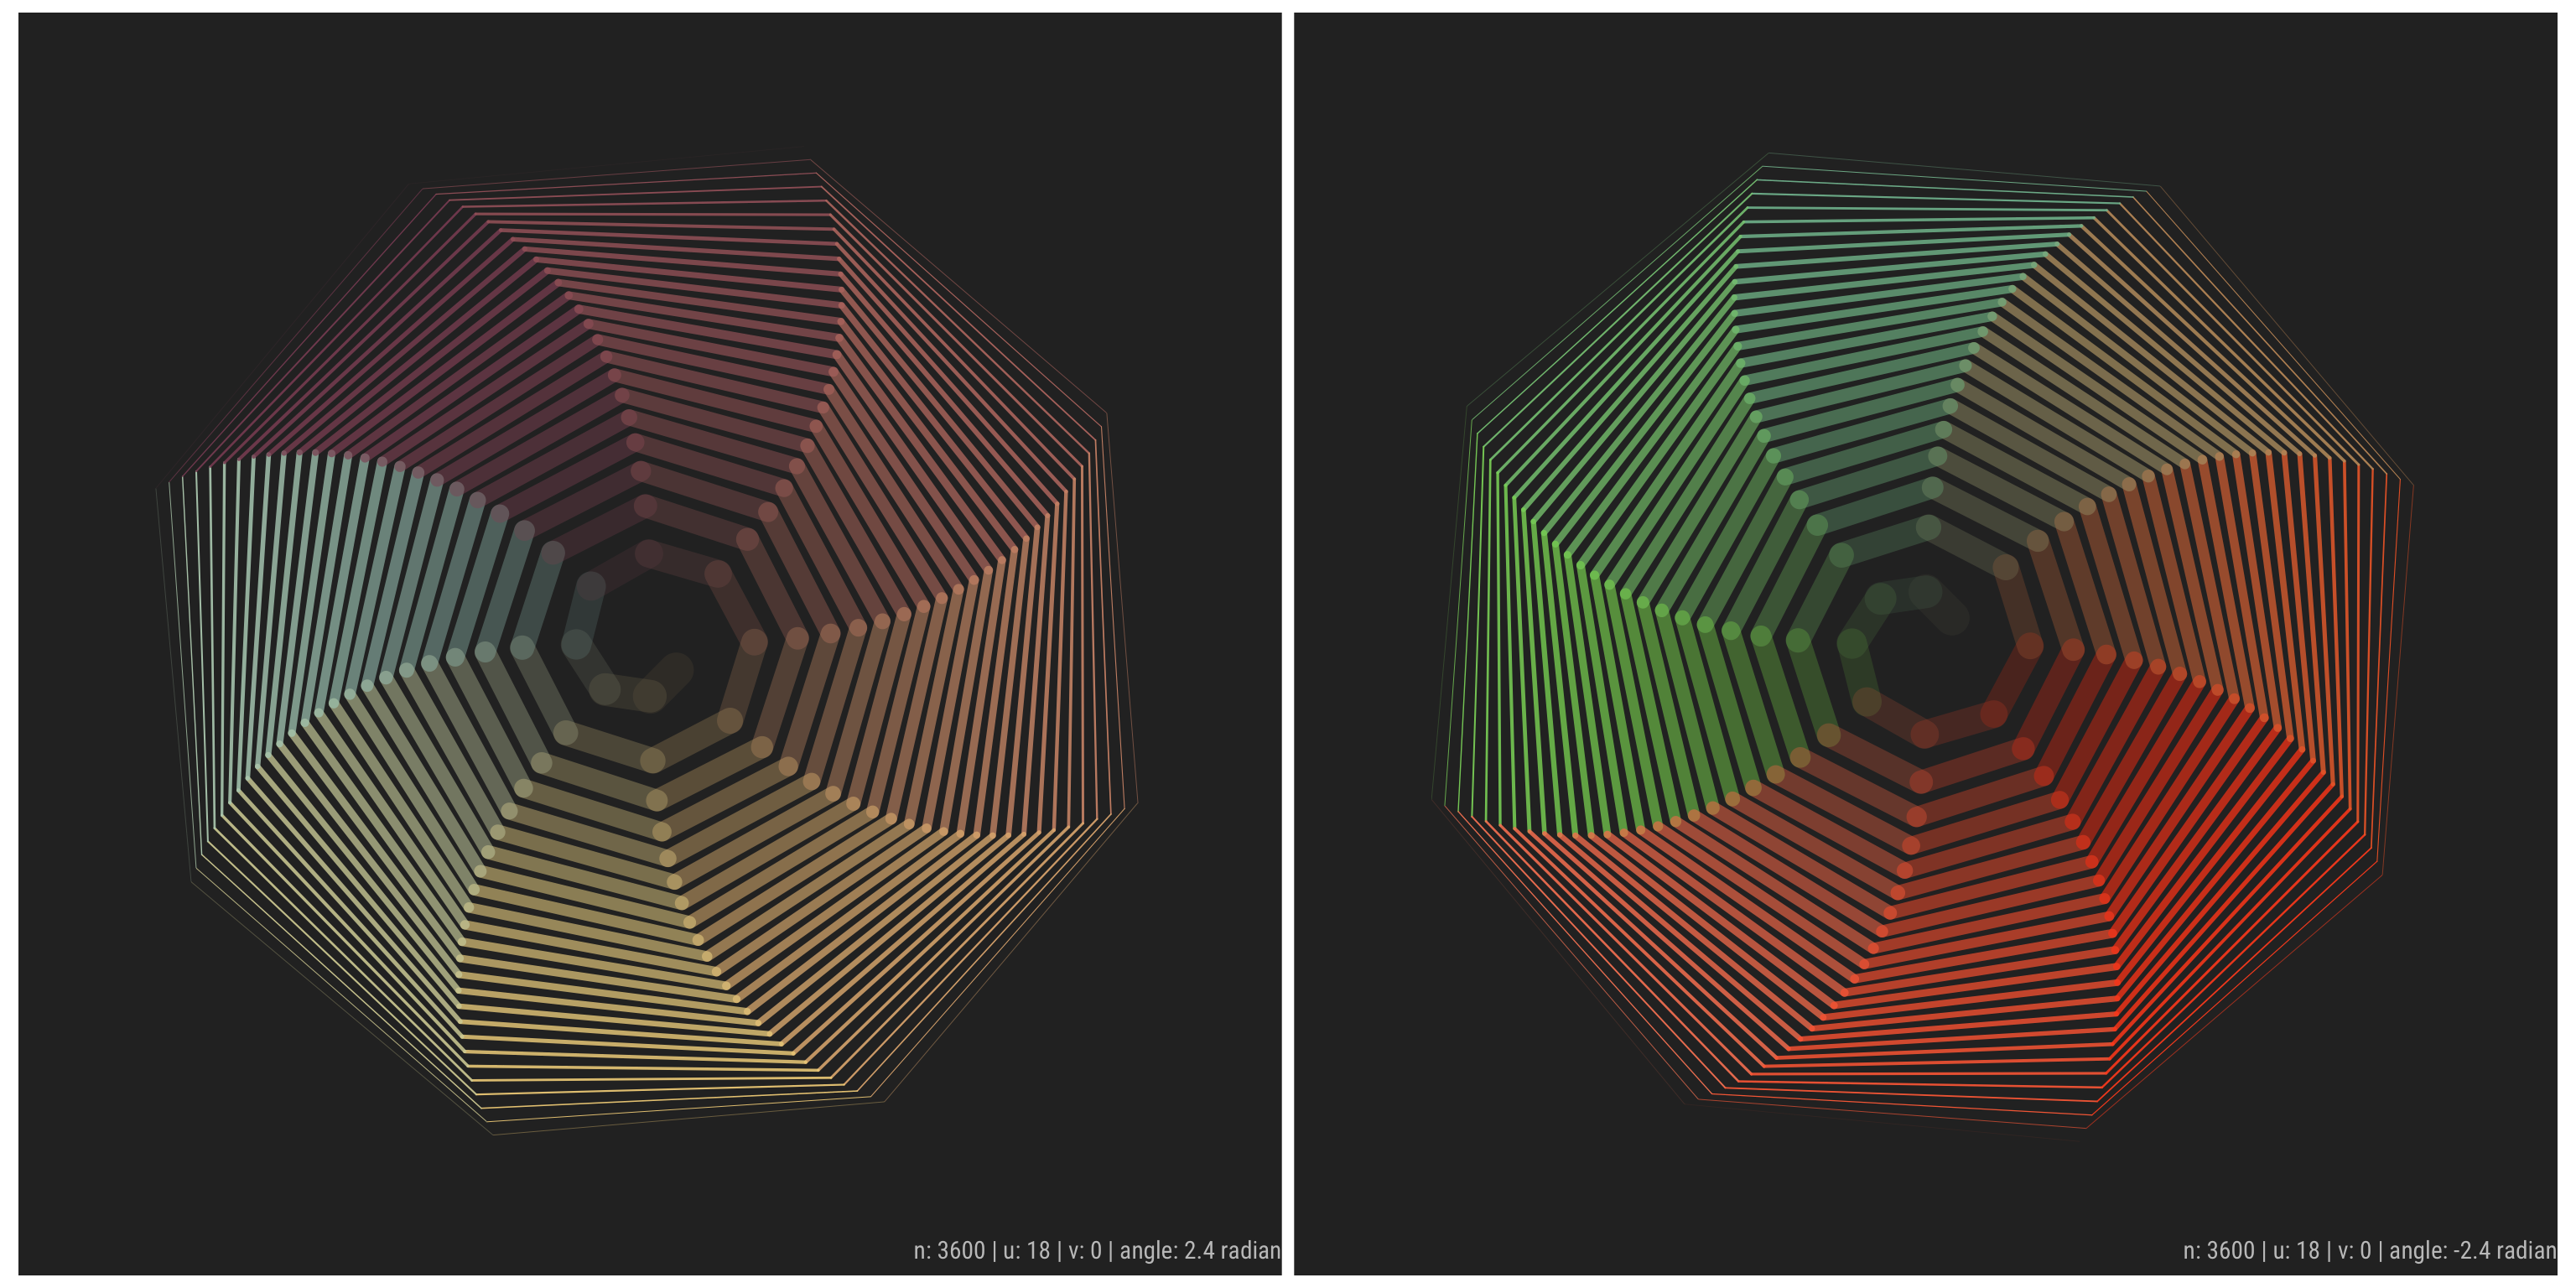
Share this post
Twitter
Google+
Facebook
Reddit
LinkedIn
Pinterest
Email